Having trouble submitting? Email us directly at nicole@beauway.com and we'll get back to you within 24 hours.











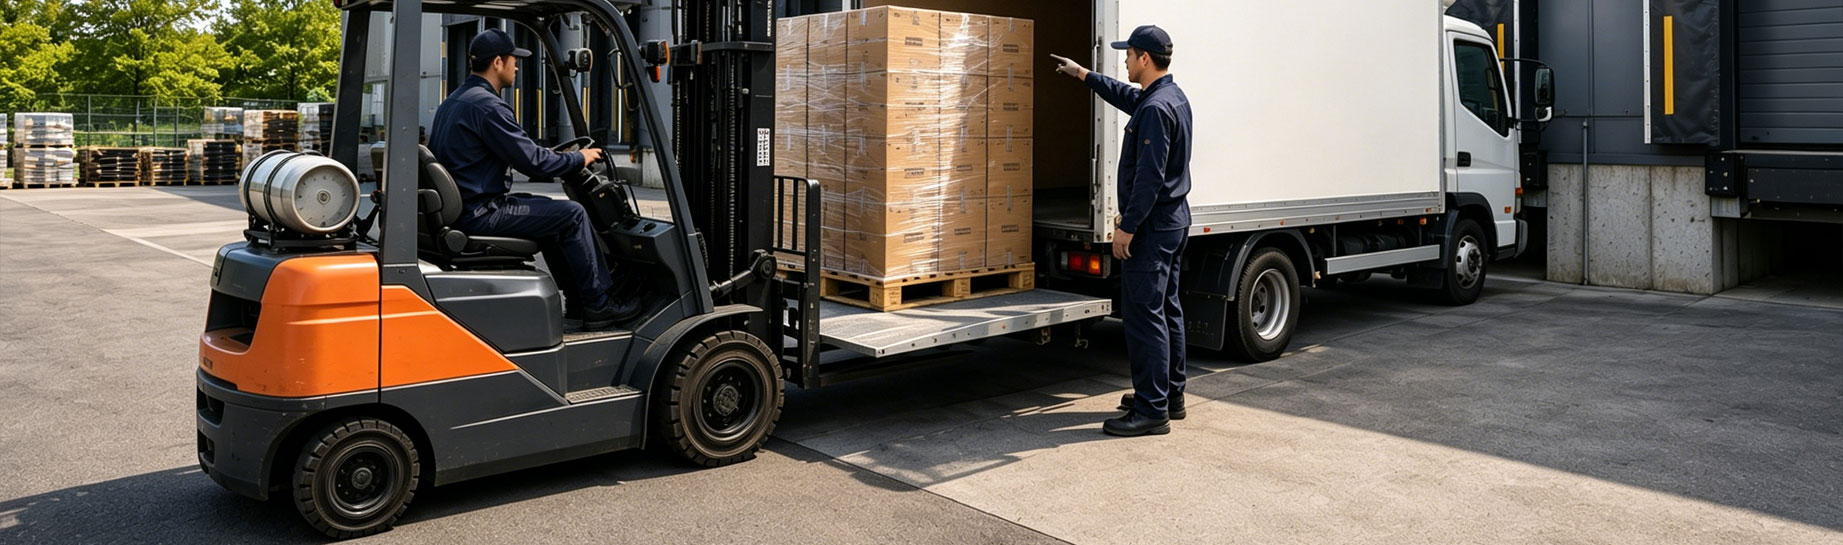
How to Calculate Tail Lift Total Cost of Ownership (TCO Guide)
Tail Lift Total Cost of Ownership: How to Calculate It (Full Guide)
You’ve probably already seen the basic tail lift total cost of ownership formula: add acquisition, operating, and maintenance costs, then subtract resale value. That framework works. But it rarely tells you what to put into each variable — and that’s where budgets go wrong.
This guide fills that gap. It covers which costs get underestimated, which hidden expenses get missed at purchase time, and how to turn a lifecycle cost figure into a payback period your finance team can act on.
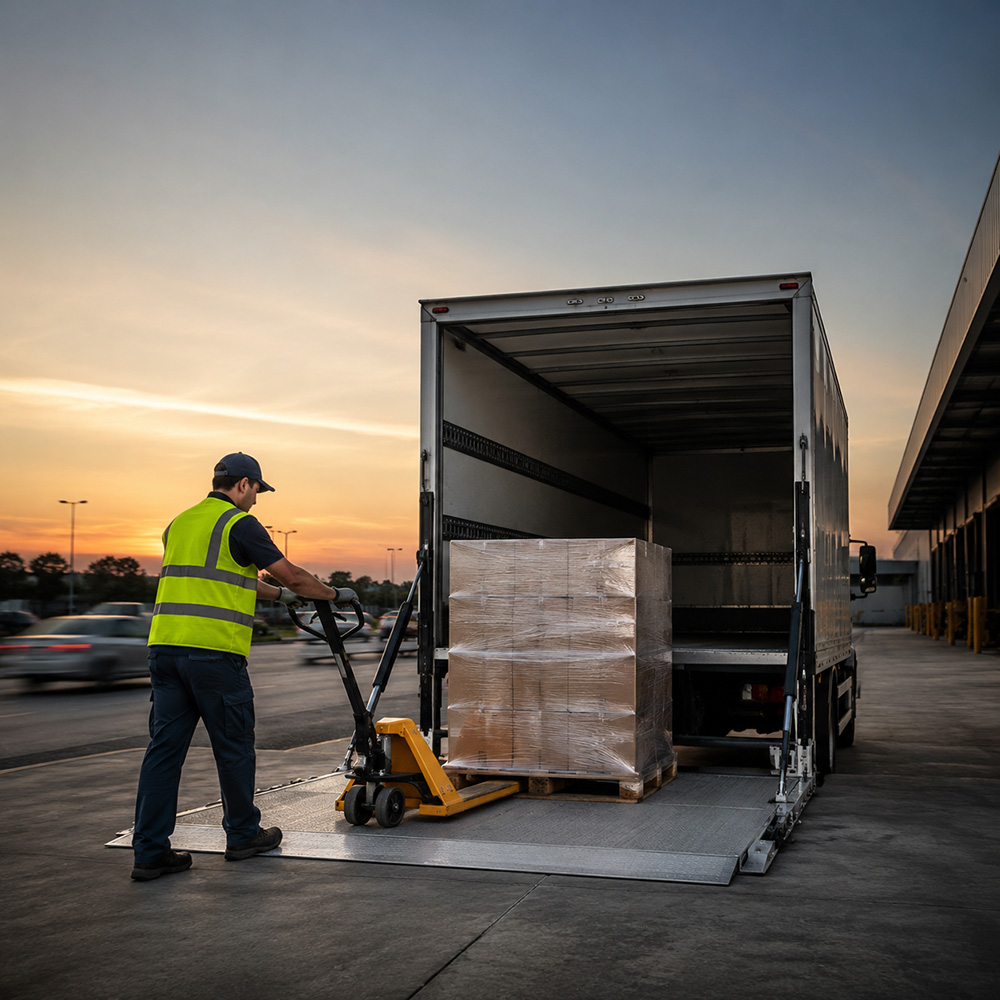
The Tail Lift Total Cost of Ownership Formula
Here’s the skeleton formula this guide builds on:
TCO = Acquisition Cost + (Annual Operating Cost + Annual Maintenance Cost) × Years of Ownership − Resale Value
The sections below fill in real numbers for each variable. They don’t treat the formula itself as the answer.
Step 1: Acquisition and Installation Costs
Tail lifts come in a few structural types. Price differences come mainly from mechanical complexity and installation difficulty, not just rated capacity.
- Column lifts: A simple vertical-post mechanism. They deploy fast and suit small-to-mid-size trucks.
- Tuckaway lifts: These fold away under the vehicle when not in use. They suit operations that mix forklift loading with dock work.
- Cantilever lifts: Higher load capacity, longer platforms. Common in supermarket and food distribution work.
- Slider lifts: Best for vehicles with limited rear clearance that need frequent-cycle loading.
On pricing: published price ranges vary enormously between sources, sometimes by several times for the same lift type. Some sources put cantilever units at a few thousand dollars entry price. Others start the same category well above five thousand. The gap usually comes down to a few factors: whether the quote includes installation, custom sizing, capacity tier, and material choice. Aluminum typically costs more than steel but resists corrosion better.
Don’t anchor your tail lift total cost of ownership budget to any single “standard” price range. Get quotes from at least two or three suppliers. Then normalize by dividing price by rated capacity, so you compare like for like. Also check whether the quote bundles in installation — suppliers usually bill this separately from the base unit price.
Step 2: Operating Costs
Operating cost comes from small line items. Each one looks minor on its own, but they add up over a multi-year hold.
- Energy draw: Electro-hydraulic lifts consume power per cycle. The exact draw depends on capacity and hydraulic efficiency. High-frequency routes see a real but generally modest annual cost here.
- Operator time: Every lift cycle adds a few minutes to loading compared with dock-based unloading. Across a full delivery schedule, this becomes a measurable labor cost. Budgets frequently leave it out entirely.
- Consumables: Hydraulic fluid top-ups, hinge lubrication, and platform wear-strip replacement cost little individually. Still, line-item them.
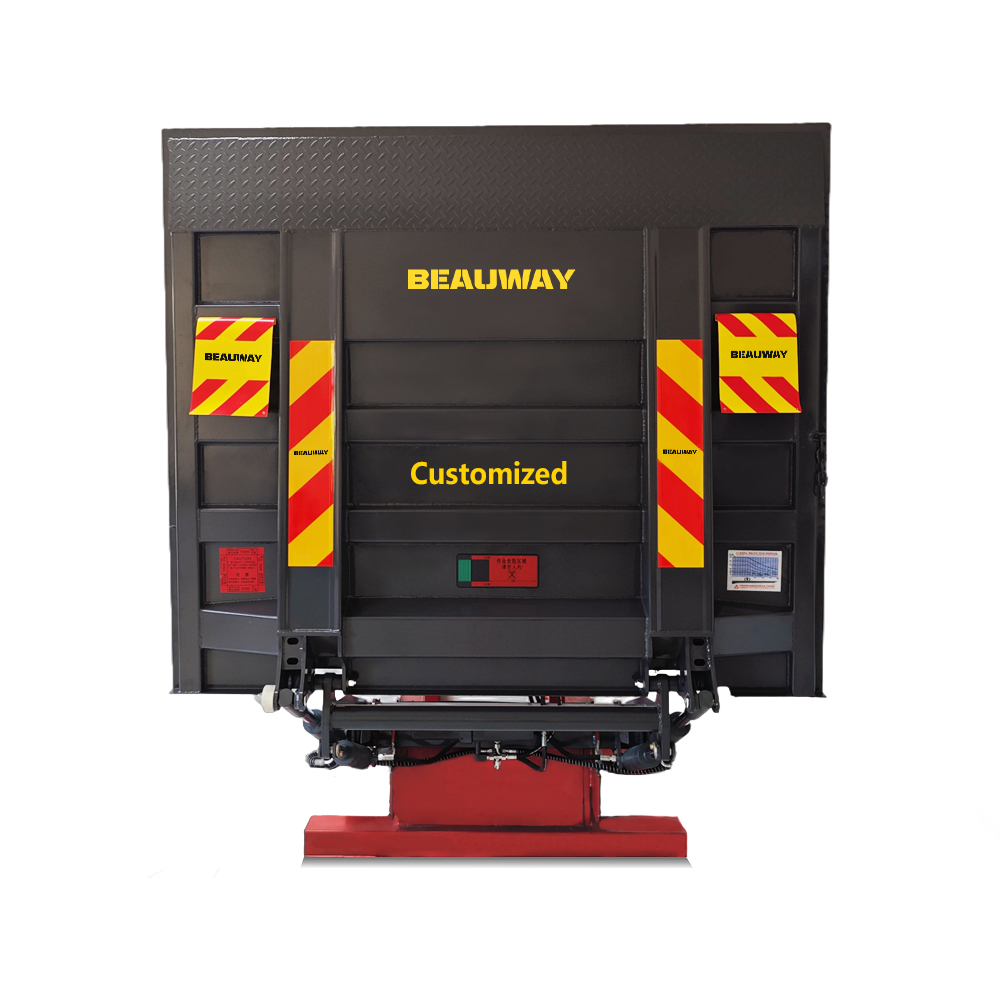
Step 3: Maintenance Costs
This section needs a caution flag. No reliable, verifiable industry benchmark exists for tail lift maintenance cost per year as a percentage of acquisition cost. Treat any figure claiming a precise percentage with skepticism unless the supplier can show its source.
A more defensible approach: break maintenance into three components and price each separately.
- Preventive maintenance (scheduled hydraulic checks, seal inspection, electrical checks): relatively predictable. Ask suppliers for an annual service plan quote directly.
- Wear parts (rollers, pins, bushings, seals): probability rises noticeably after year three. Ask for a supplier parts list with unit prices instead of relying on a blanket percentage.
- Major repairs (pump, cylinder, or motor failure): infrequent but potentially costly. Probability increases sharply past year five. Budget a contingency reserve for this instead of assuming it won’t happen.
Step 4: The Cost of Downtime
Almost every tail lift total cost of ownership guide mentions downtime cost. Almost none actually quantify it. The underlying logic stays simple:
Downtime Cost = (Hours Out of Service) × (Value Lost Per Hour of Operation)
Here’s an illustrative walkthrough of the method. The numbers below are placeholders that demonstrate the calculation. They aren’t real statistics, so substitute your own fleet’s data.
Say a vehicle generates X dollars of delivery value per operating hour. A lift failure takes it out of service for 8 hours: diagnosis, parts sourcing, repair. That happens twice a year. The math looks like this:
8 hours × X × 2 incidents = annual downtime cost
Replace X with your fleet’s actual delivery value per hour. A reasonable starting point: divide daily route revenue by operating hours. This turns the formula into a usable planning tool instead of an abstract exercise. The specific number matters less than the underlying point: downtime routinely exceeds the maintenance line item itself, and purchase comparisons often miss it entirely.
Parts lead time drives this multiplier. The same failure can mean a next-day part or a week-long wait, depending on the supplier’s regional stock. That difference can swing downtime cost several-fold. A lower sticker price on the lift itself doesn’t guarantee a lower long-term cost if parts support runs weak.
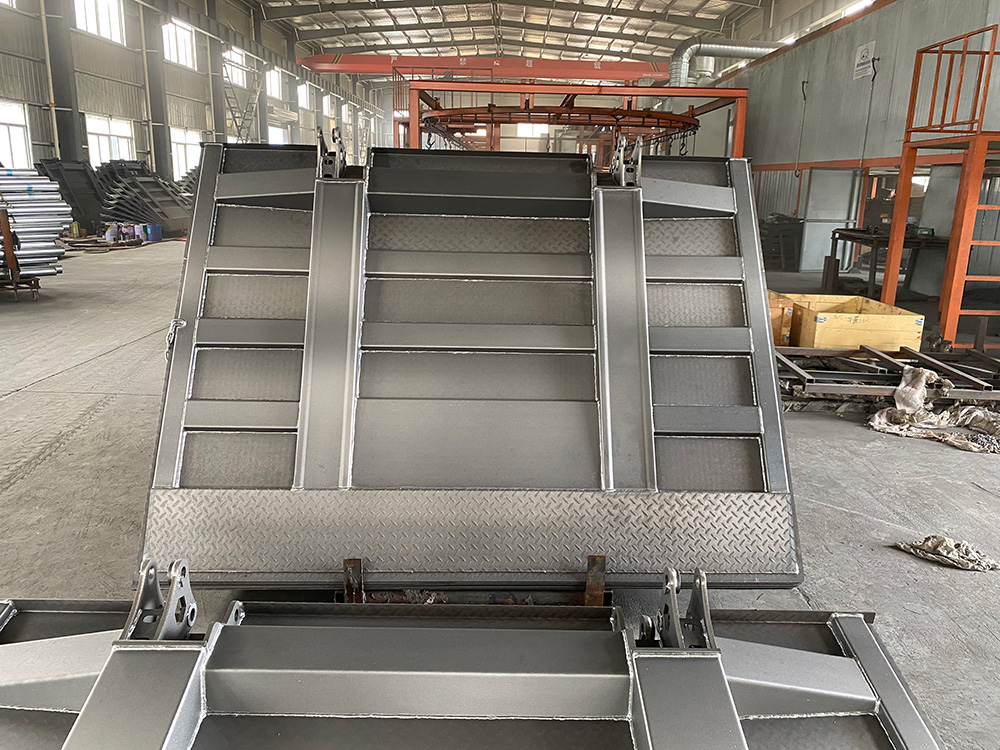
Step 5: Depreciation and Resale Value
Tail lift depreciation broadly follows the shape of general equipment depreciation curves: slower in early years, then accelerating. But no reliable, category-specific published data exists for tail lift resale value curves. Treat any source quoting precise year-by-year percentages with caution.
One thing holds true with more confidence: complete, documented service history measurably improves your negotiating position at resale. Buyers of used commercial equipment routinely discount units with gaps in maintenance records. In other words, the maintenance spend from Step 3 partially returns itself through better value over time at resale.
Hidden Costs That Affect Tail Lift Total Cost of Ownership
Statutory safety inspection: Local lifting-equipment regulations typically require periodic third-party safety examination for lifting equipment, including tail lifts. Inspection frequency generally depends on use case. Equipment that lifts people typically needs more frequent examination, commonly every 6 months. Equipment used purely for goods handling typically follows a longer cycle, commonly every 12 months. Per-inspection cost varies by equipment complexity, region, and whether the inspector examines multiple units in one visit. Batching multiple lifts at a single site generally costs less than single-unit visits. This recurring, legally required cost sits separately from maintenance. Buyers easily miss it at purchase time.
Insurance loading: Vehicles fitted with tail lifts may see a modest premium adjustment on relevant policy lines. This often applies where manual handling of heavier loads happens. The amount varies by insurer and region. Get a direct quote rather than assuming a standard uplift.
Operator training and recertification: Manual handling and lift-operation training typically needs periodic refreshing, commonly every 1–3 years per operator. Costs vary meaningfully by region and training provider. Check locally instead of budgeting off a generic figure.
Parts lead time: This doesn’t appear as its own invoice line. It still amplifies the downtime cost above whenever a repair comes up.
Add these together. A fleet running multiple tail-lift-equipped vehicles will typically carry a recurring compliance-and-training cost, entirely outside the basic maintenance line. The exact total depends heavily on fleet size, local regulation, and insurance terms. Don’t estimate it from a generic industry figure.
Calculating ROI and Payback Period
Once you have a TCO figure, ask a more useful question: how long until this investment pays for itself?
Payback Period (years) = Net Investment Cost ÷ Annual Value Generated
“Annual value generated” typically combines three things:
- Labor saved versus manual or dock-based unloading
- Additional delivery capacity from faster loading cycles
- Reduced damage and claims costs from safer loading
Here’s another illustrative walkthrough. Again, these are placeholder figures that demonstrate the method, not verified statistics.
Say a cantilever lift’s installed cost equals Y. It saves Z1 in annual labor value. It also saves Z2 in reduced damage claims each year. The formula looks like this:
Payback Period = Y ÷ (Z1 + Z2)
Substitute your fleet’s real labor rates, delivery frequency, and historical damage-claim data. This produces a genuinely usable payback period figure. It supports a real financial planning conversation, not a vague “it’s probably worth it” argument. This is also the number that turns an investment cost into a defensible business case.
Tail Lift Cost vs. Forklift: A Comparison
Some operations weigh tail lifts against dock or forklift-based loading. This usually comes up as part of broader fleet equipment planning. The cost structures differ in meaningful ways:
| Cost Factor | Tail Lift (per vehicle) | Forklift (typically shared resource) |
|---|---|---|
| Acquisition cost | Lower — typically low thousands of dollars | Substantially higher — commonly tens of thousands for a standard warehouse unit |
| Annual maintenance | No reliable universal benchmark; price per component | Electric models typically cost less to maintain than fuel-powered ones |
| Operator certification | Basic manual handling training | Formal operating certification, with periodic recertification |
| Site dependency | None — works at any delivery point | Requires dock access or level ground |
| Downtime impact | Affects a single vehicle | Can bottleneck an entire yard or warehouse |
| Best fit | Multi-drop, distributed delivery | Centralized, high-volume warehouse loading |
Here’s the practical takeaway. For distributed delivery with modest per-drop volume, tail lifts generally offer better flexibility and more contained downtime risk. For centralized warehouses moving large volumes per lift, forklifts stay more cost-efficient per unit moved. Many fleets run both instead of choosing exclusively.
Frequently Asked Questions About Tail Lift Total Cost of Ownership
How should I budget for tail lift maintenance? No verified universal percentage benchmark exists. Request a preventive-maintenance plan quote directly from your supplier. Separately reserve a contingency for wear-part replacement and major-repair risk instead of applying a generic ratio.
What’s a realistic payback period? No single industry-standard figure applies here. Payback period depends heavily on delivery frequency, labor cost, and your baseline damage and claims history. Use the formula above with your own operating data instead of a published benchmark.
Is it cheaper to buy or lease a tail lift? Leasing shifts maintenance and depreciation risk to the lessor. It tends to cost more, though, over a hold period beyond roughly seven years. Buying tends to win on total ownership cost for fleets keeping vehicles long-term. Leasing suits shorter replacement cycles or fleets that prioritize predictable monthly costs.
How do I decide between a tail lift and a forklift? If delivery points sit spread out and per-drop volume stays moderate, a tail lift is typically the better choice. If operations run centralized with high per-lift volume, a forklift typically wins on efficiency. Many operations use both instead of treating it as an either/or decision.
Final Thoughts on Tail Lift Total Cost of Ownership
The tail lift total cost of ownership formula stays simple. Filling each variable with real numbers instead of assumptions is the hard part. Buyers routinely underestimate downtime and compliance-related hidden costs relative to maintenance. Treat any confidently precise industry-wide percentage or price range as a starting point, not a decision input. That holds true unless it comes with a clear source. The most reliable numbers will always come from your own fleet’s operating data and your own suppliers’ actual quotes.
Trusted by Fleet Operators Across 60+ Countries
Stop Losing Time at the Loading Dock.
Get a Custom-Matched Tail Lift Quote in 24 Hours.
60
Countries Served
24h
Quote Turnaround
99.9
Field Uptime
5.0
Customer Rating
No Obligation
CE & UKCA Certified
Standard & Custom Builds
Worldwide Shipping